
UX Score
An internal UX‑debt monitoring system: standardized UX/CX issues in Jira, team scoring, dashboard trends and rankings, and a React frontend.
Context
Inside a large organization, dozens of product teams managed development in Jira. UX problems existed across products, but there was no shared standard for tracking UX debt: issues lived in different backlogs, leadership lacked a system‑level view, and UX work kept losing priority to business tasks.
The task was not to create another report. It was to turn UX debt from a subjective feeling into a manageable operating system.
Problem
At the organizational level it was impossible to quickly answer which teams had the highest UX debt, which problems repeated systematically, which areas were degrading, and how fast teams resolved UX issues. UX remained an area without transparent numbers or KPIs.
- UX/CX issues were scattered across different Jira backlogs and projects.
- Teams labeled issues differently, so the data could not be compared directly.
- Leadership saw individual complaints, but not a map of systemic problems.
- UX debt accumulated gradually and became visible too late.
Solution
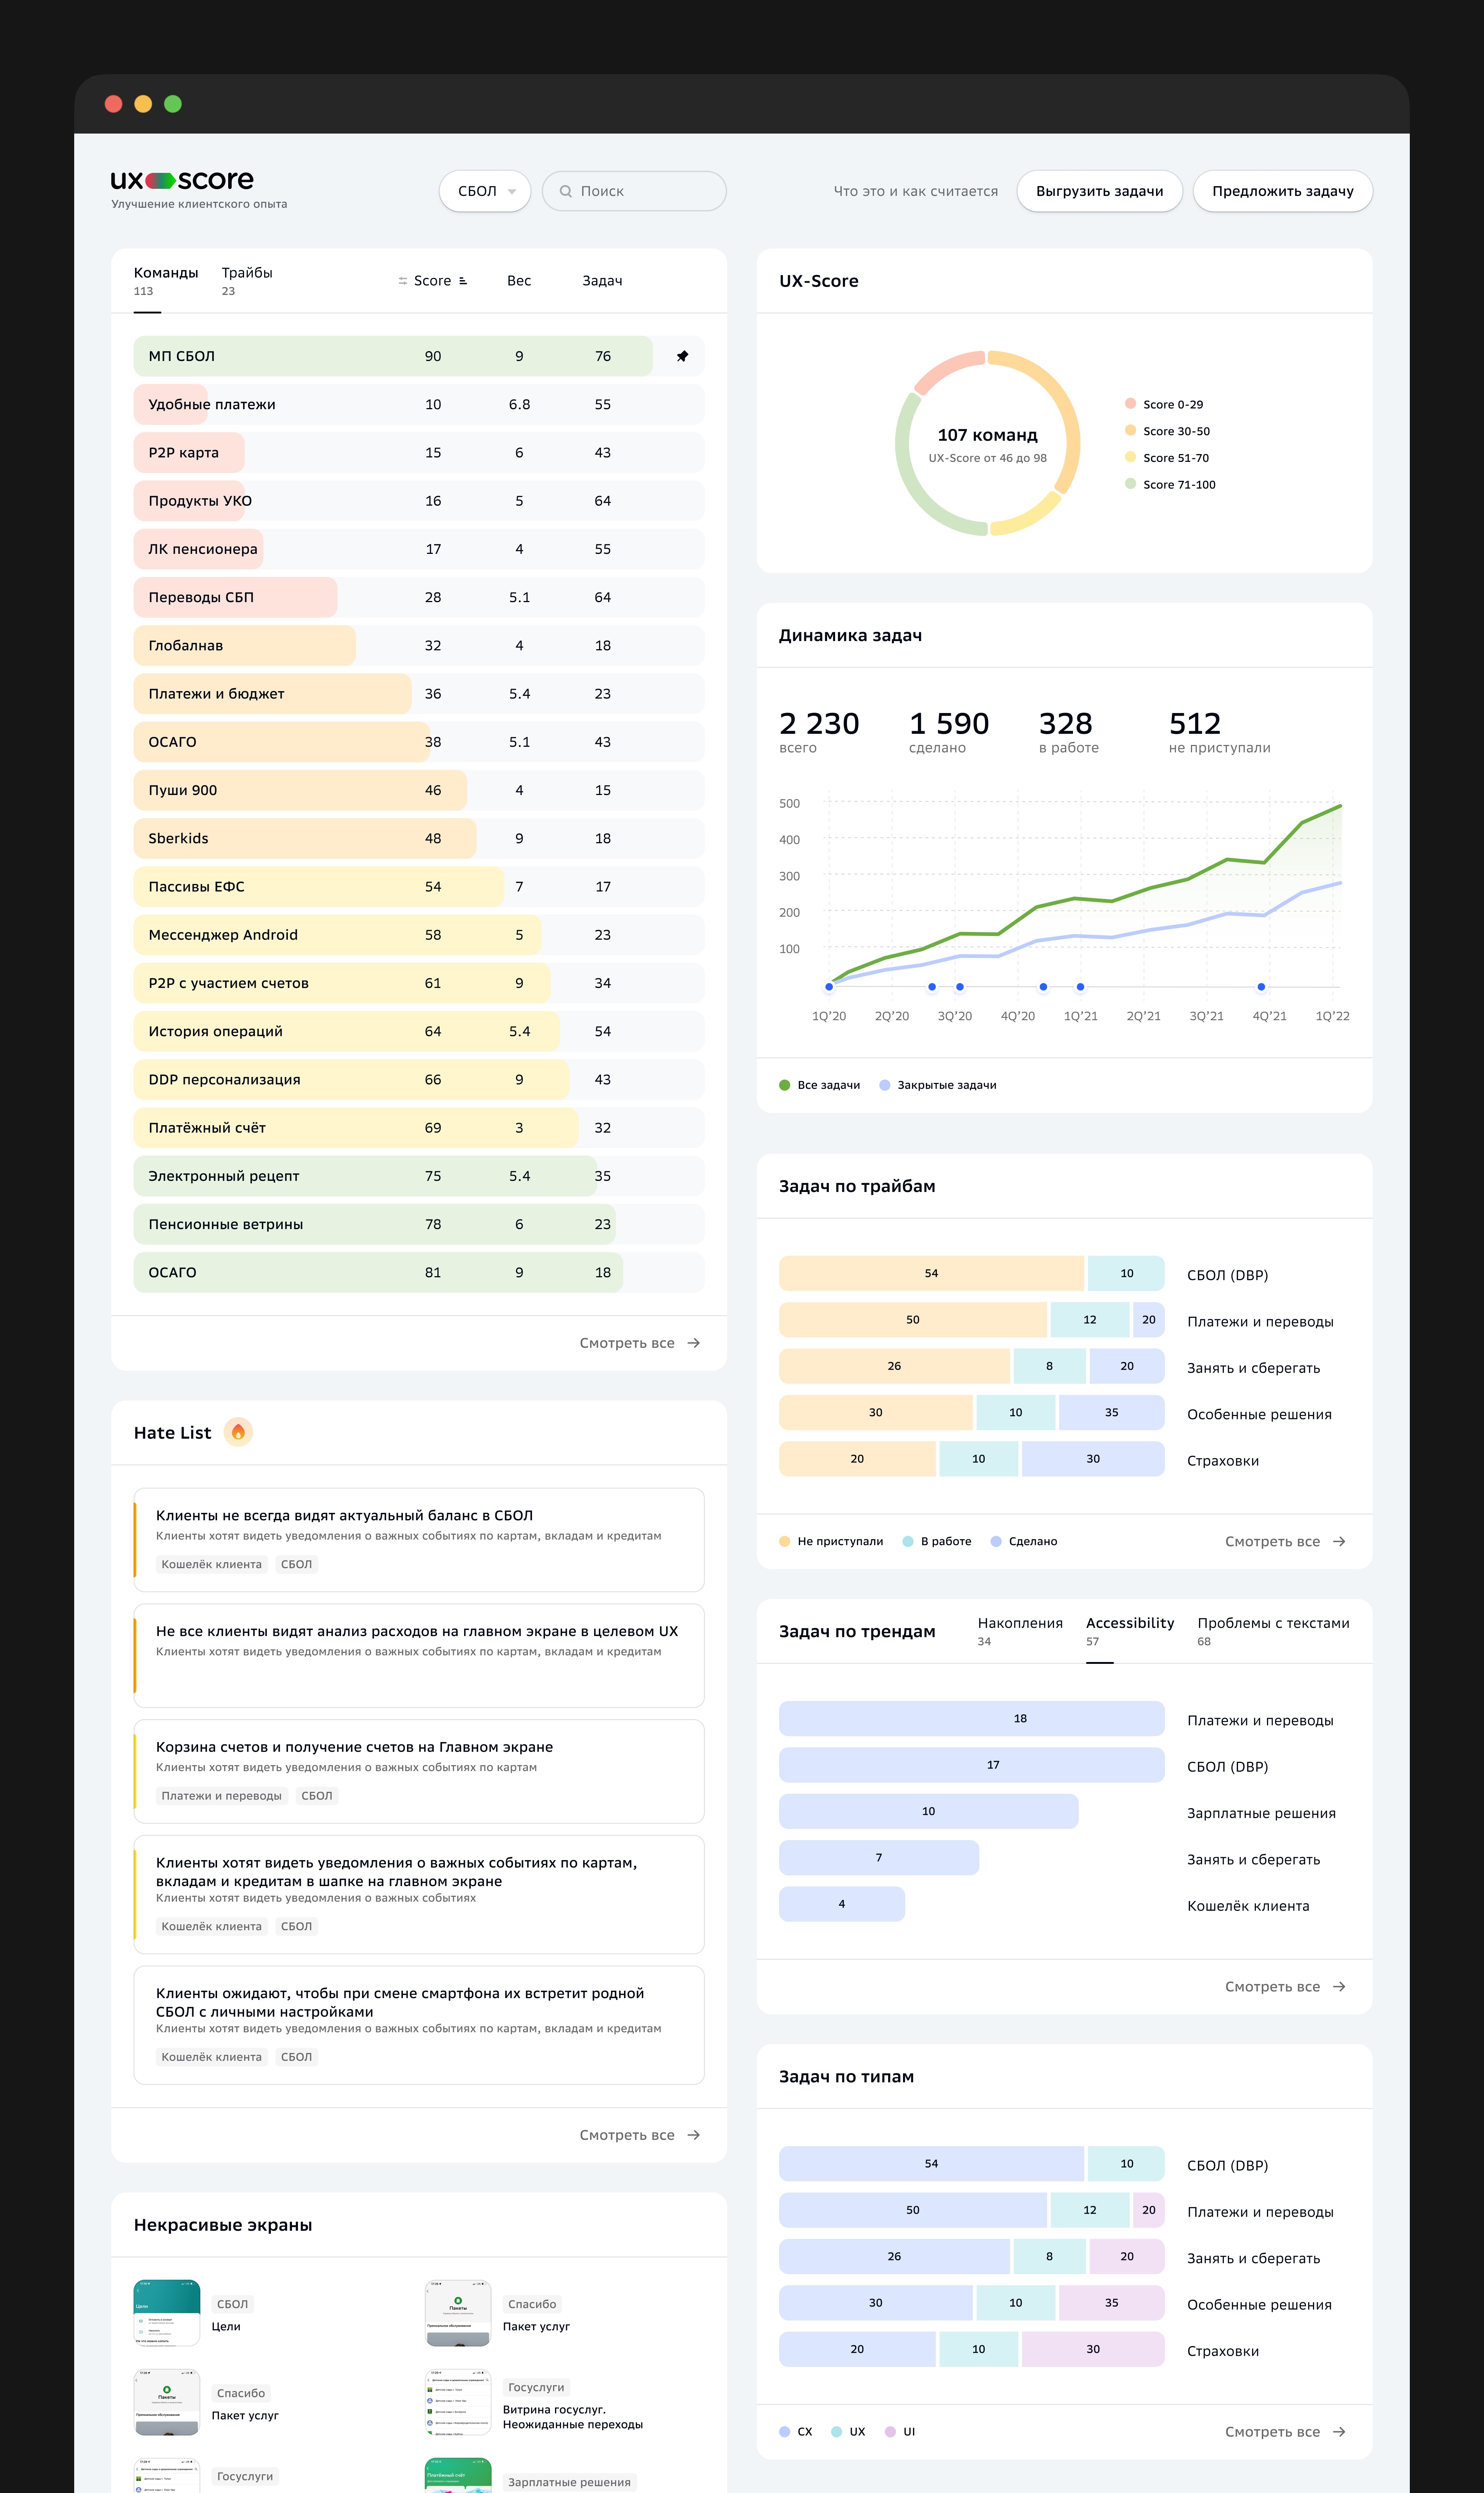
I designed the interface and developed the frontend for UX Score, an internal dashboard for monitoring teams' UX debt. The backend collected data from Jira, cleaned and normalized it, while the frontend received prepared high‑quality data and visualized UX health across the organization.
Each team received a UX Score from 0 to 100. The formula considered the number of UX issues, problem severity, statuses, resolution speed, and debt accumulation. The formula had to stay understandable: teams needed to see why they received a specific score.
| Score | Interpretation |
|---|---|
| 0–30 | Critical UX debt |
| 30–50 | Weak UX state |
| 50–70 | Average level |
| 70–100 | Good UX state |
Dashboard
The main screen followed one principle: understand the system state in 10–15 seconds. Team rankings created social comparison, color signals showed severity, and the Hate List moved the conversation from abstract tickets back to real user pain.
- Team ranking and score distribution.
- Issue dynamics: total, done, in progress, and not started.
- Breakdowns by tribes, issue types, accessibility, copy, and problematic screens.
- A Hate List with the most painful UX problems.
Team Tools
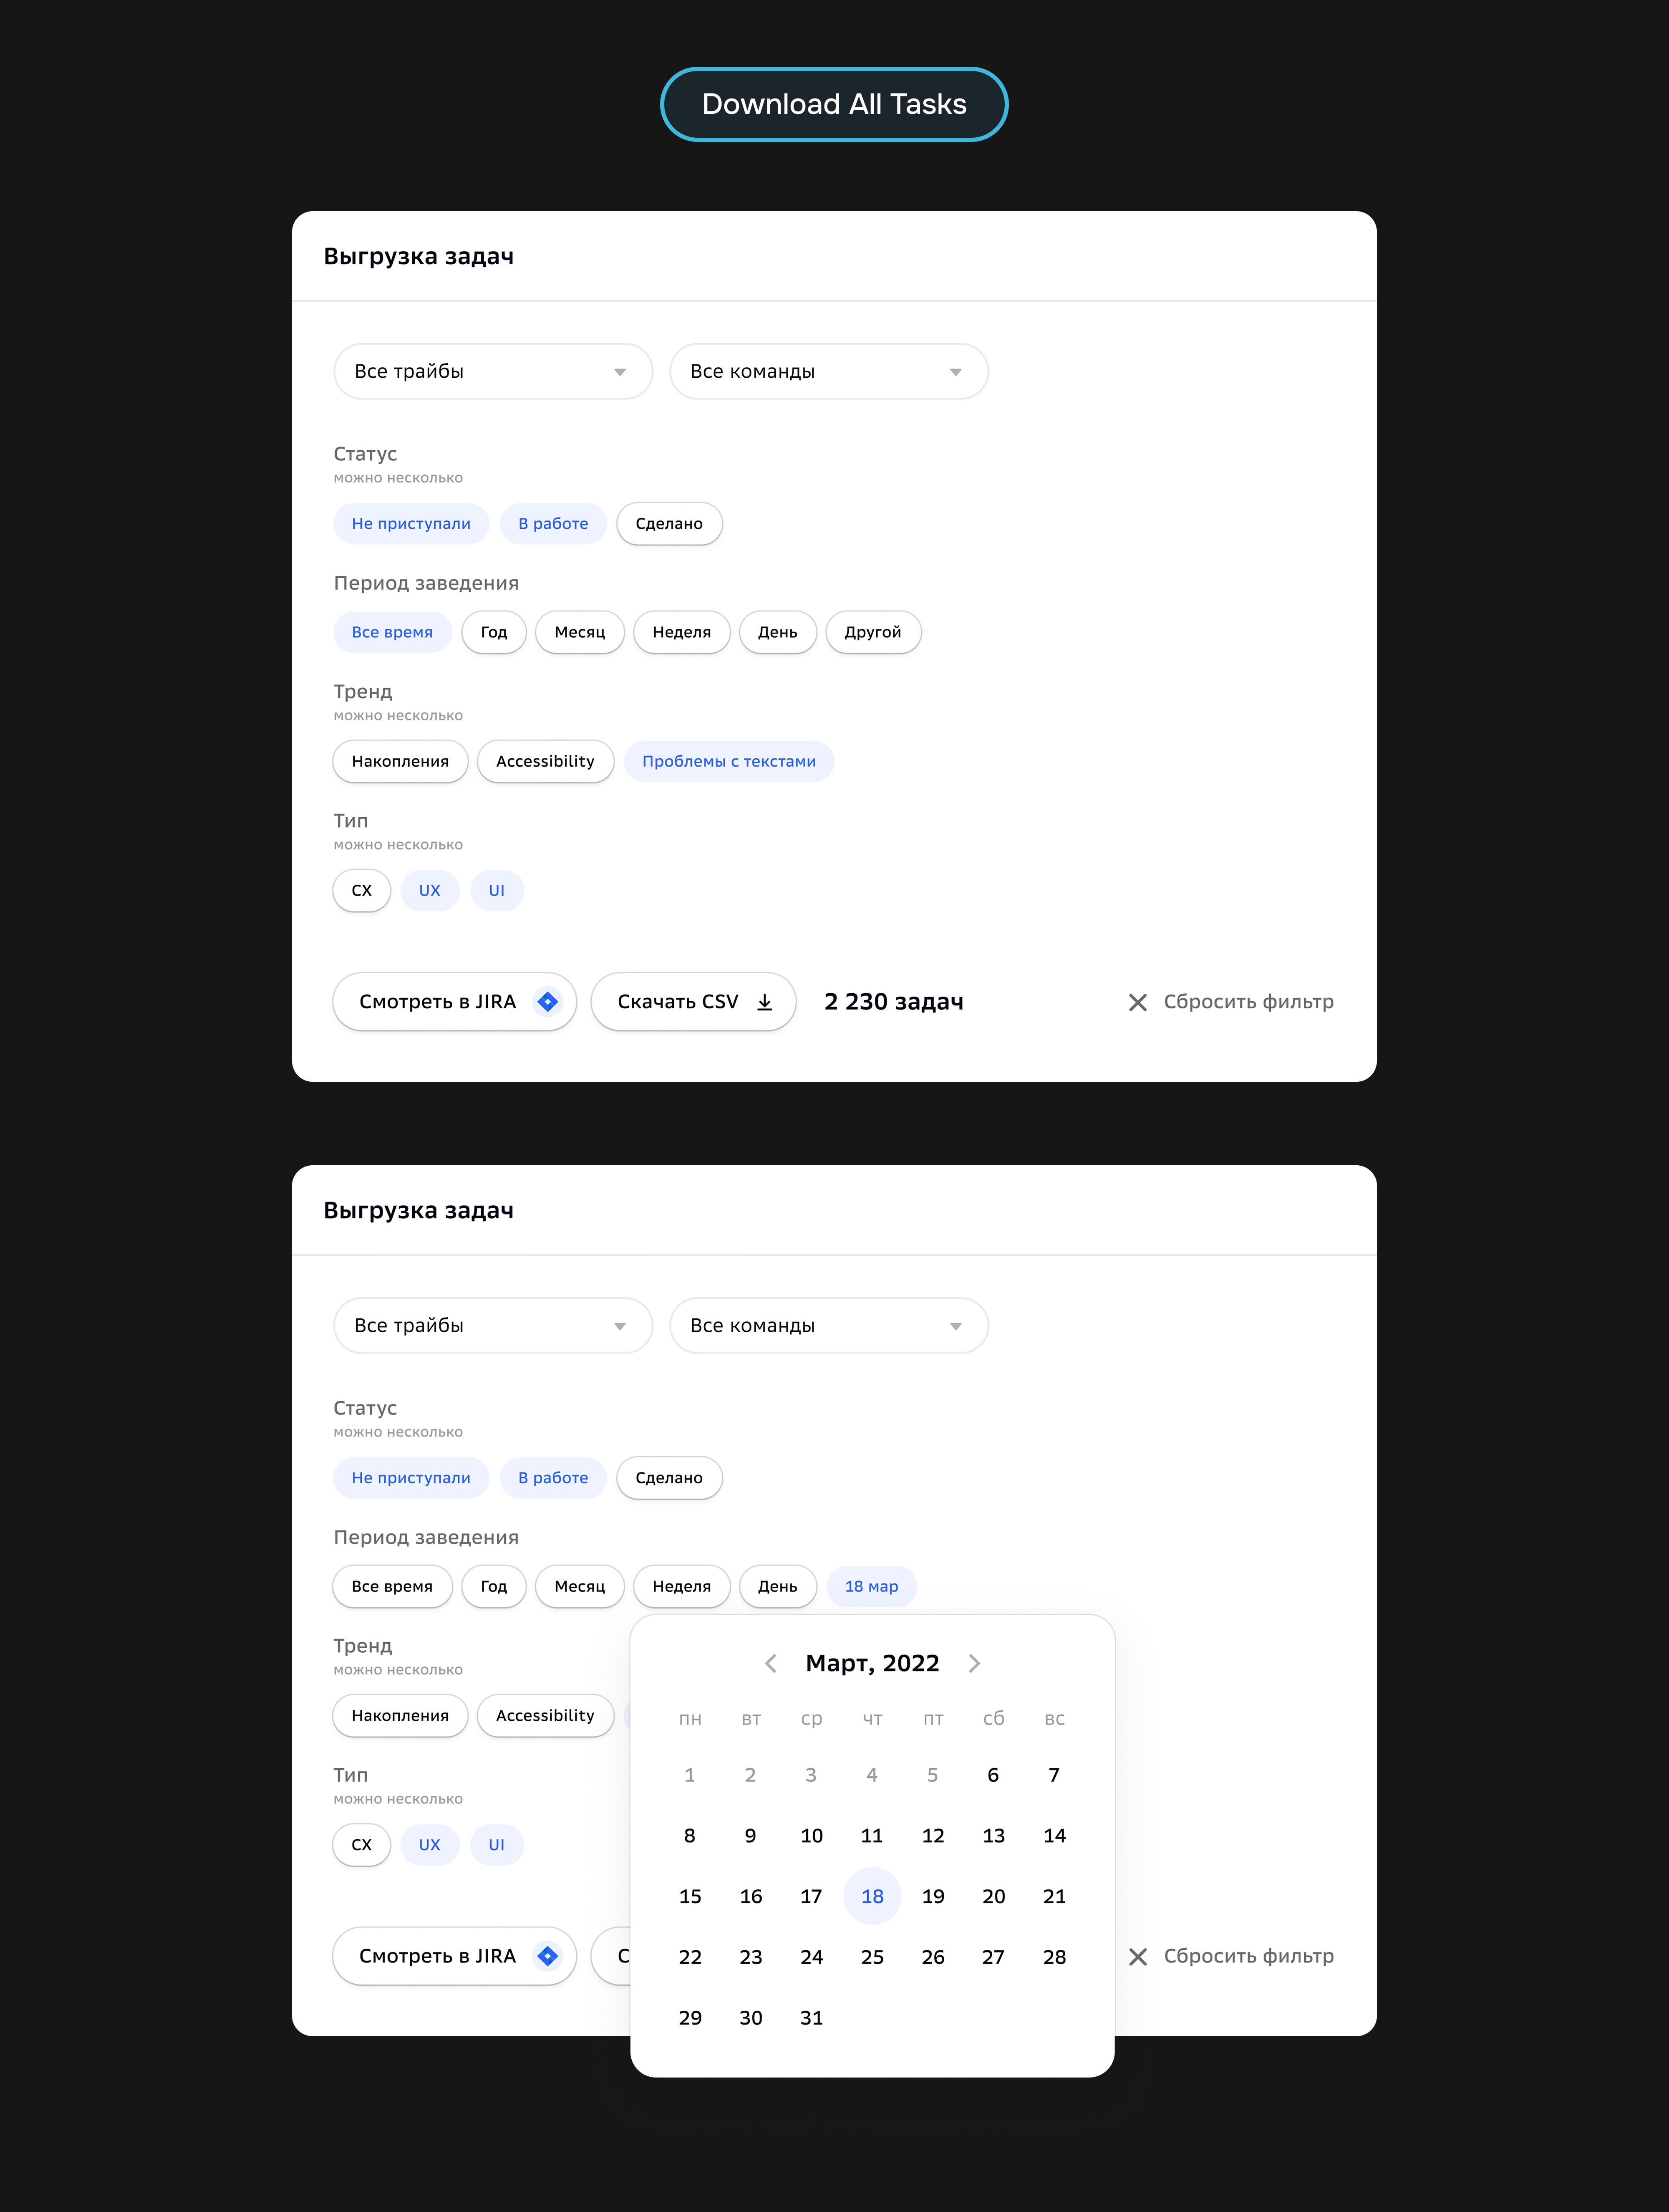
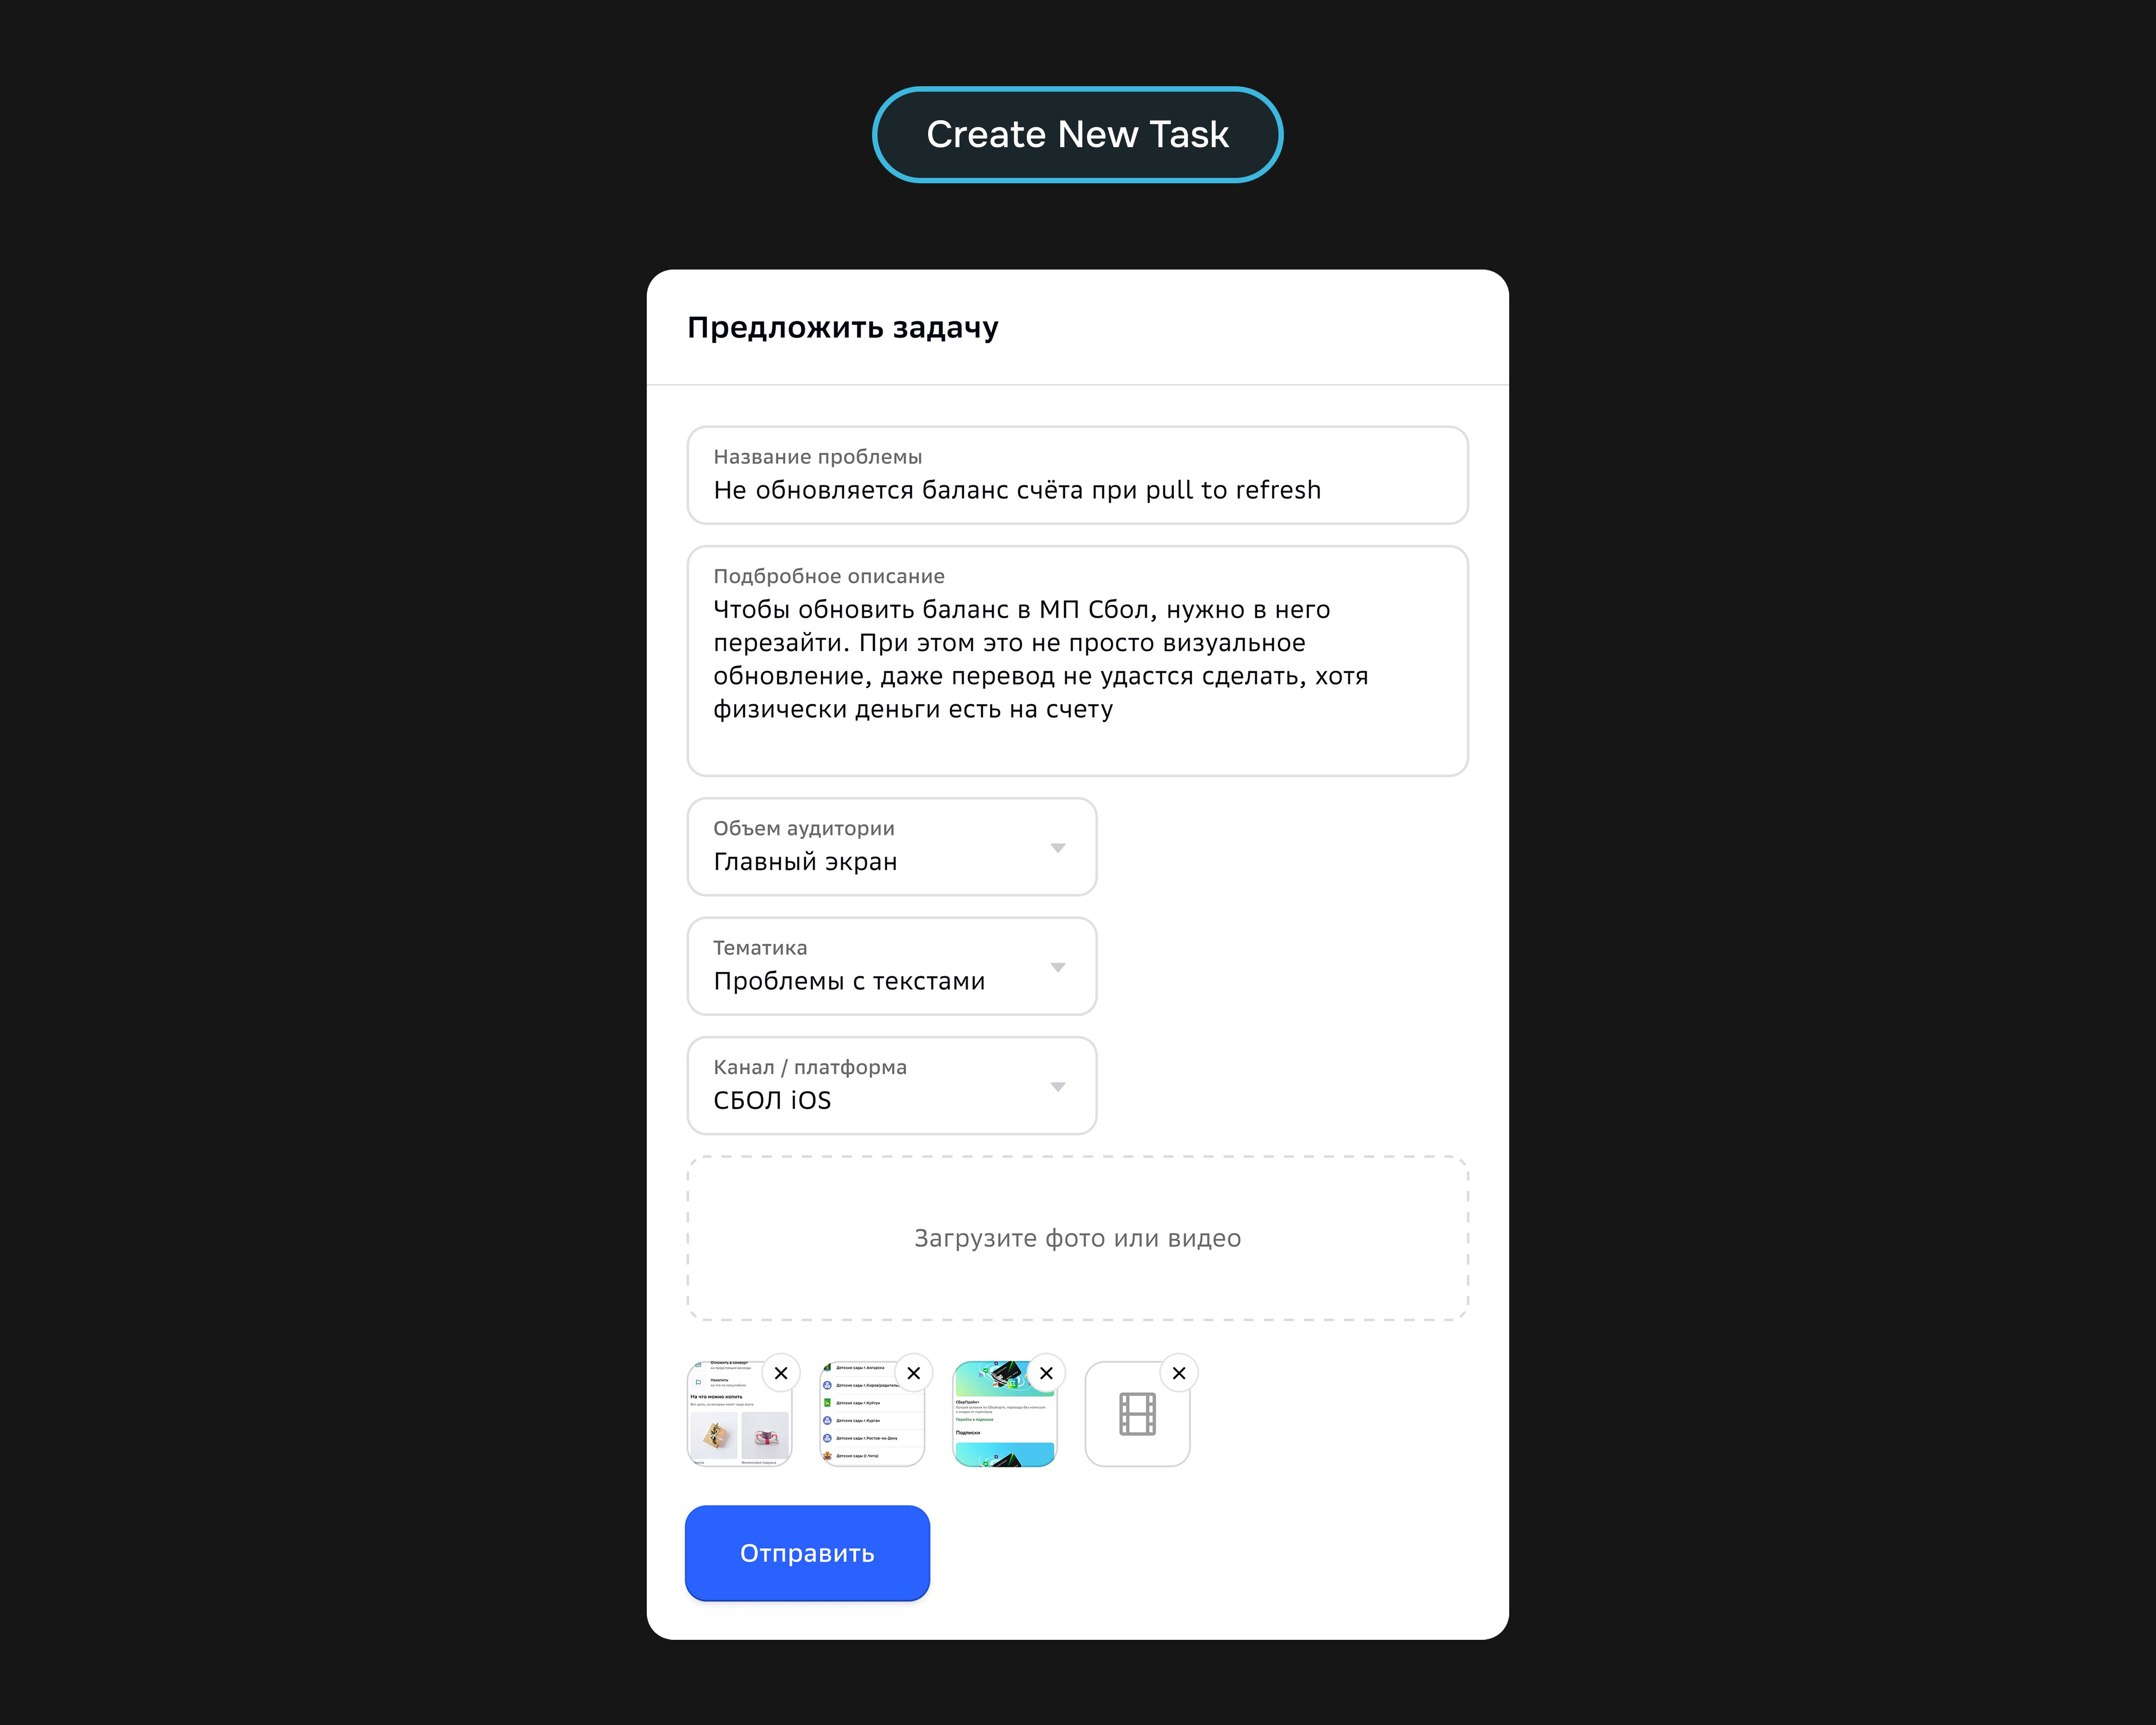
Beyond the main dashboard, the system gave teams concrete actions: export task sets, open a filtered list in Jira, download CSV, or submit a new problem. This kept the product from stopping at observation and helped move problems into the backlog.
Implementation
I owned the UX/UI and React frontend: screen structure, states, filters, tables, cards, charts, and integration with the prepared-data API. The backend supplied an already cleaned and normalized Jira dataset, so the interface focused on readability, team comparison, and fast actions.
- React frontend and dashboard visualization.
- Connecting the frontend to an API with cleaned Jira data.
- Visualizing UX Score, issue dynamics, and comparisons between teams.
- A soft read‑only launch to reduce team resistance.
Results
- UX issues started entering teams' active work more often.
- Fewer UX problems were left abandoned without movement.
- Leadership received a map of problem areas and UX quality dynamics by direction.
- Teams could discuss UX debt through shared data instead of isolated complaints.
After launch, the system started affecting processes: UX debt became visible, comparable, and discussed on a regular basis.
The main result: UX stopped being perceived as a designers' initiative and became part of the company's operating system.
Takeaway
UX Score created a shared language between design, product, and management: transparency, measurability, UX‑debt prioritization, and connection to development processes. The most valuable part was not the polished dashboard, but the fact that the interface started changing team behavior.